AOV Calculator
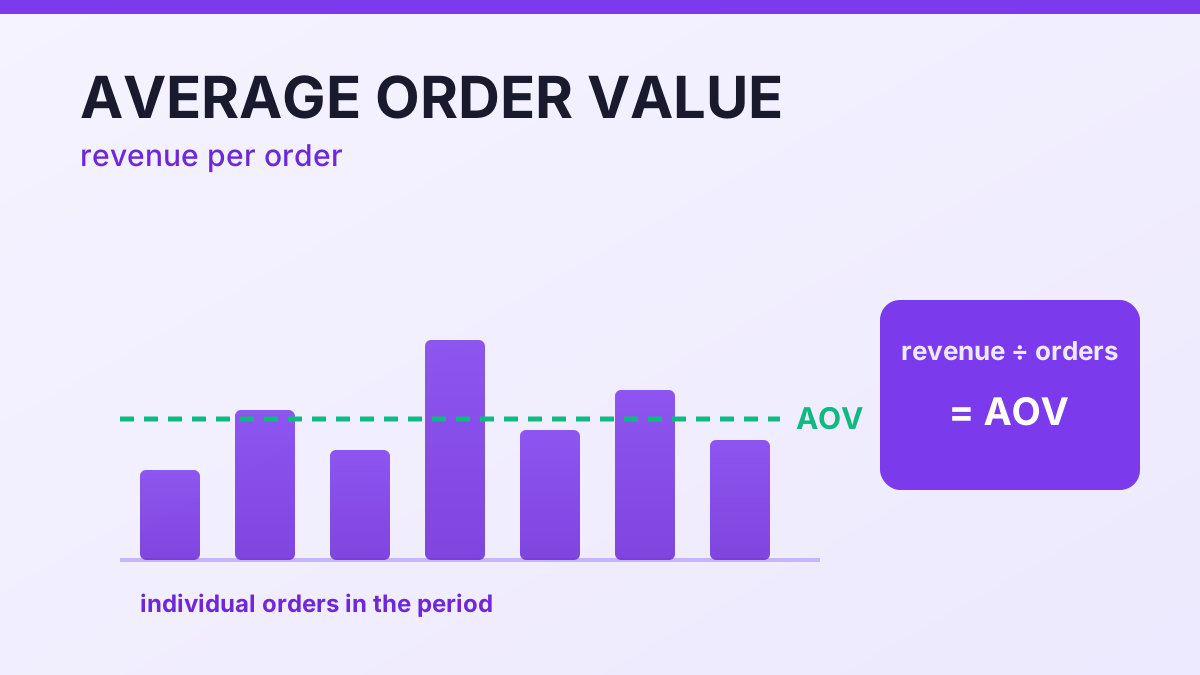
Average order value is the revenue each order brings on average: divide total revenue by the number of orders in the same period. Add margin and ad spend and the average order value calculator shows what an order really contributes.
Calculate your average order value
How to calculate average order value
How to calculate average order value takes two numbers from the same period: total revenue and total orders. Divide revenue by orders and you have AOV. A store that books $50,000 across 1,200 orders is running an average order value of $50,000 ÷ 1,200 = $41.67.
The average order value formula is unforgiving about consistency. Decide once whether revenue is gross or net of discounts and returns, whether taxes and shipping are inside the figure, and whether every channel shares the same definition — then keep that definition month after month. A metric that silently changes conventions cannot be trended or benchmarked, and AOV is one of the few growth numbers where a two-dollar definitional shift looks exactly like a strategy win.
The average order value calculator above re-runs the division for any period, then adds the two numbers that decide whether the basket is actually working: gross profit per order and the advertising cost behind each order.
Average order value benchmarks by industry in 2026
What is a good average order value is a question about your category, not about the internet. Published benchmarks disagree sharply because their samples do: Shopify's own guidance places the cross-industry global AOV near $145, while a 2026 panel of 2,934 active stores puts the median at $312 with the middle 50% of stores between $159 and $667.
| Category | Median AOV (H1 2026) |
|---|---|
| Autos & vehicles | $652 |
| Business & industrial | $428 |
| Apparel & accessories | $418 |
| Beauty & personal care | $270 |
| Health & wellness | $177 |
| Food & beverage | $172 |
An older but still widely quoted benchmark set (Dynamic Yield data cited by LoyaltyLion) sits lower again — apparel around $194, consumer goods near $199, home and furniture near $247 — because it tracks different retailers in different years. One set is not wrong and the other right; the point is that a single global AOV target is meaningless. Compare your store with your own category, your own device mix and your own trailing six months, and treat published medians as orientation rather than a grade.
How to use this calculator
- Enter total revenue for the period. Use the revenue from the orders you are analysing: gross sales minus discounts, or net of returns — as long as the definition does not change halfway through a comparison. The average order value calculator only needs this and the order count.
- Add the number of orders from the same window. Orders, not customers. A repeat buyer places two orders and belongs in the count twice, otherwise your basket size is overstated for exactly the shoppers who buy most.
- Add margin to turn the average order value formula into profit per order. Gross margin converts revenue per order into the money you actually keep, which is the figure that should survive a bigger basket. A large order with no margin is not a win.
- Add ad spend to see what each order costs. With media spend for the same period, the breakdown returns cost per order, the ratio between AOV and cost per order, and the contribution per order left after advertising.
Frequently asked questions
What is a good average order value in 2026?
It depends entirely on category: medians in a 2026 panel ran from $172 in food and beverage to $652 in autos and vehicles, with apparel near $418, while Shopify's cross-industry figure sits closer to $145. A good AOV is above your own category median and rising without deeper discounting.
How to calculate average order value for a quarter or a year?
Use total revenue and total orders from that exact window and divide. Longer windows smooth seasonality, so a quarterly AOV is safer than a single month when you compare stores or channels, and a twelve-month figure is the fairest baseline for a target.
Does average order value include shipping and taxes?
Usually not: most definitions use merchandise revenue, which excludes taxes and shipping, and refunds reduce the numerator when you report net revenue. What matters more than the convention is declaring it and applying it consistently across every period you compare.
How to increase average order value in ecommerce?
Bundles, cross-sells on the cart page, free-shipping thresholds set just above your current AOV, and tiered pricing on repeat-purchase products. Test one lever at a time and watch contribution per order, because revenue can rise while profit falls.
Can average order value be too high?
Yes, if the basket grows through forced bundles or minimums that push conversion rate down. AOV and conversion rate trade off against each other, and revenue per visitor — the product of the two — is the number that settles whether a higher basket was worth the customers it cost.
How to increase average order value
How to increase average order value without training customers to wait for discounts: bundle complementary products so the basket grows before price enters the conversation, set a free-shipping threshold 20% to 30% above your current AOV and let the gap do the selling, and put tiered volume pricing on consumables where repurchase is predictable. Cross-sells on the cart page generally beat post-purchase offers, because the money is still on the table when the decision is made.
Margin discipline matters more than the headline. A 20% AOV lift bought with a deeper discount can leave contribution per order flat or lower, which is exactly why the average order value calculator returns gross profit per order and ad spend per order beside the average position. AOV is also the first input in customer lifetime value and the second lever after conversion rate in revenue per visitor, so raising it lifts every downstream growth metric at once.