Cart Abandonment Rate Calculator
Cart abandonment rate is the share of shoppers who add an item to a cart but never buy: abandoned carts divided by carts created. Enter both numbers to see your rate, the carts lost, and what a realistic abandoned cart recovery rate would bring back.
Calculate your cart abandonment rate
How to calculate cart abandonment rate
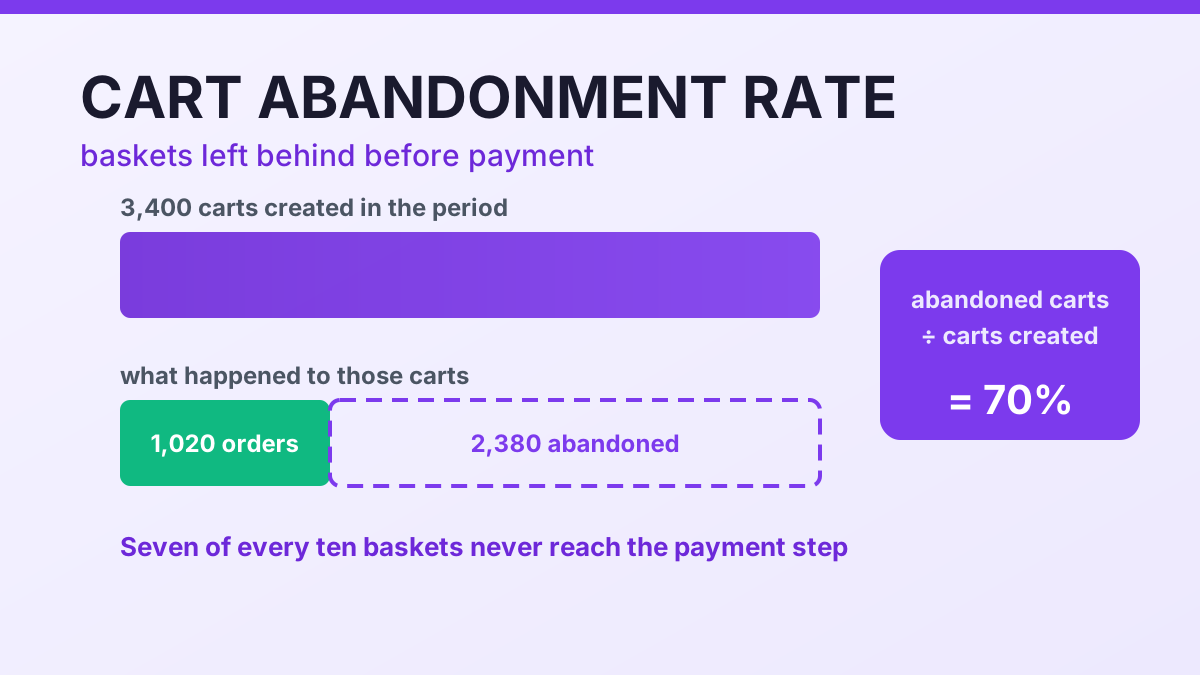
Take two counts from the same period: carts created, meaning sessions where a product entered the basket, and orders completed. Subtract the orders from the carts, divide the difference by the carts created, and multiply by 100. A store with 3,400 carts created and 1,020 orders leaves 2,380 baskets behind, so 2,380 ÷ 3,400 = 70%. That is the whole calculation — and it is exactly what this cart abandonment rate calculator does with your own numbers.
Three conventions decide the figure you get, and changing them mid-year is the usual reason a rate suddenly looks healthier. First, whether a cart means an add-to-cart session or a checkout initiation: the add-to-cart version is stricter and the one Baymard-style benchmarks use. Second, whether guest checkout, marketplace and telephone orders all land in the same order count. Third, how bots, internal traffic and staff test orders are filtered. Write the three rules down once and keep them fixed; a percentage that silently changes its own definition cannot be trended or benchmarked.
What is a good cart abandonment rate in 2026
Start from the documented baseline. Across 50 compiled studies, Baymard Institute puts the average abandonment rate at 70.22%; the same institute's own checkout tracking has held near 70.19% for 14 years. Roughly seven in ten baskets are left behind, so 68% is not a crisis and 85% is a specific problem worth locating rather than a number to argue with.
Before blaming the checkout, separate unavoidable from fixable abandonment. In Baymard's 2026 survey, 42% of US shoppers who had abandoned a cart in the previous quarter said they were just browsing or not ready to buy — traffic no checkout design will convert. Among the fixable reasons, the largest single cause is the checkout process being too long or complicated, cited by 17% of shoppers, which is why form work usually pays before offer work does.
| Reference point, 2026 | Figure | What it tells you |
|---|---|---|
| Average documented abandonment rate (50 studies) | 70.22% | The benchmark to sit near or below |
| Baymard tracked average (14 years of checkout testing) | 70.19% | The rate has barely moved in a decade |
| Shoppers who abandoned because they were just browsing | 42% | Unavoidable abandonment: do not chase it |
| Abandoned because checkout was too long or complicated | 17% | The biggest fixable cause |
| Conversion uplift available from checkout design alone | +35.26% | The ceiling of a checkout redesign |
| Abandoned US and EU orders recoverable through design | $260 billion | The size of the prize at market level |
Read device splits as a diagnostic, not a grade. Cross-device panel data from Barilliance put phone abandonment near 80.79% against 73.93% on desktop, and a gap that wide is usually a form problem wearing a mobile costume. If your mobile rate runs ten points above desktop, fix the form before you touch pricing, shipping thresholds or new creative.
How to use this calculator
- Count the carts created in the period. Pull the number of sessions where a product was added to the cart, not total site visits. A visitor who browsed five pages and never added anything is not an abandoned cart, and counting them flatters the denominator while hiding the real loss.
- Add the orders completed in the same window. Use orders that were actually paid for, from the same dates and the same channel definition. If a marketplace or telephone order shares the window, decide once whether it belongs in the count and then never change that rule mid-comparison.
- Apply the cart abandonment rate formula to both counts. Run the subtraction and the division and you have the rate. The calculator returns the abandoned cart count, the abandonment percentage and the completion percentage side by side, because the completion figure is the one your checkout work has to move.
- Price the abandoned carts with your AOV. Add average order value and the result converts into lost revenue. Add a recovery rate taken from your own flows and the breakdown shows what a realistic win-back programme is worth in orders and dollars — the figure to take into a budget conversation.
Frequently asked questions
How to calculate cart abandonment rate for a month?
Use carts created and orders completed from that same month: (carts created − orders) ÷ carts created × 100. A single month is noisy, so run a rolling four-week figure next to it and compare like with like — December against December, not December against January.
What is a good cart abandonment rate for ecommerce stores?
Around 70% is the documented average: 70.22% across 50 compiled studies and 70.19% in Baymard's own 14-year tracking. Anything below that is already better than the documented baseline, and category matters more than the headline — luxury, jewellery and high-consideration electronics run far above food, pet care and everyday consumables.
What abandoned cart recovery rate should I assume?
Use your own flows rather than a published number. Vendor benchmarks range from roughly 5% to 20% of abandoned carts, but they disagree because each counts a different denominator. Recovered orders divided by abandoned carts in your store is the only figure that models your funnel honestly.
Why is my cart abandonment rate higher on mobile?
Mobile checkout usually fails on form design rather than intent: more fields, no autofill, and on-screen keyboards that hide the total. Cross-device panel data has put phone abandonment near 80.79% versus 73.93% on desktop. If your own mobile gap is wider than that, test the form before the offer.
Is cart abandonment the same as checkout abandonment?
No. Cart abandonment counts every session that added a product and left without ordering. Checkout abandonment counts only sessions that started the checkout flow and stopped. The second is always lower, and the gap between them tells you whether shoppers lose interest in the product or in the form.
Turning the rate into dollars
A percentage only earns attention once it is money. Multiply abandoned carts by average order value to see the merchandise that walked away, then multiply again by the share of those carts your flows realistically win back. With 2,380 abandoned carts on an $85 basket, $202,300 of demand sat in baskets; recovering one cart in ten puts $20,230 of it back on the books.
Be sceptical about the recovery figure you feed in. Published vendor benchmarks disagree sharply — email and SMS flows are credited with everything from about 5% to 20% of abandoned carts — because each platform divides by a different denominator: carts created, carts with a captured email, or carts that received the first message. Recovered orders divided by abandoned carts in your own store is the only number worth planning with, and it runs higher on considered, high-ticket purchases than on impulse buys.
Finally, keep the two repair jobs separate. Checkout friction is a design problem with a documented ceiling: Baymard's research puts the conversion gain from design fixes at 35.26% for the average large retailer, roughly $260 billion of recoverable orders across US and EU ecommerce. Recovery messaging is a marketing problem that only works on shoppers who wanted the product and got interrupted. Fix the first, then measure the second — otherwise you are emailing people who never intended to buy.
Sources
- Baymard Institute — 50 Cart Abandonment Rate Statistics 2026 (average 70.22%, 50 studies, updated September 2025)
- Baymard Institute — Cart & Checkout Usability Research (70.19% tracked average, 35% conversion uplift, $260B recoverable)
- Barilliance — Cart abandonment statistics by device (2019 panel: phone 80.79% vs desktop 73.93%)