Sell-Through Rate Calculator
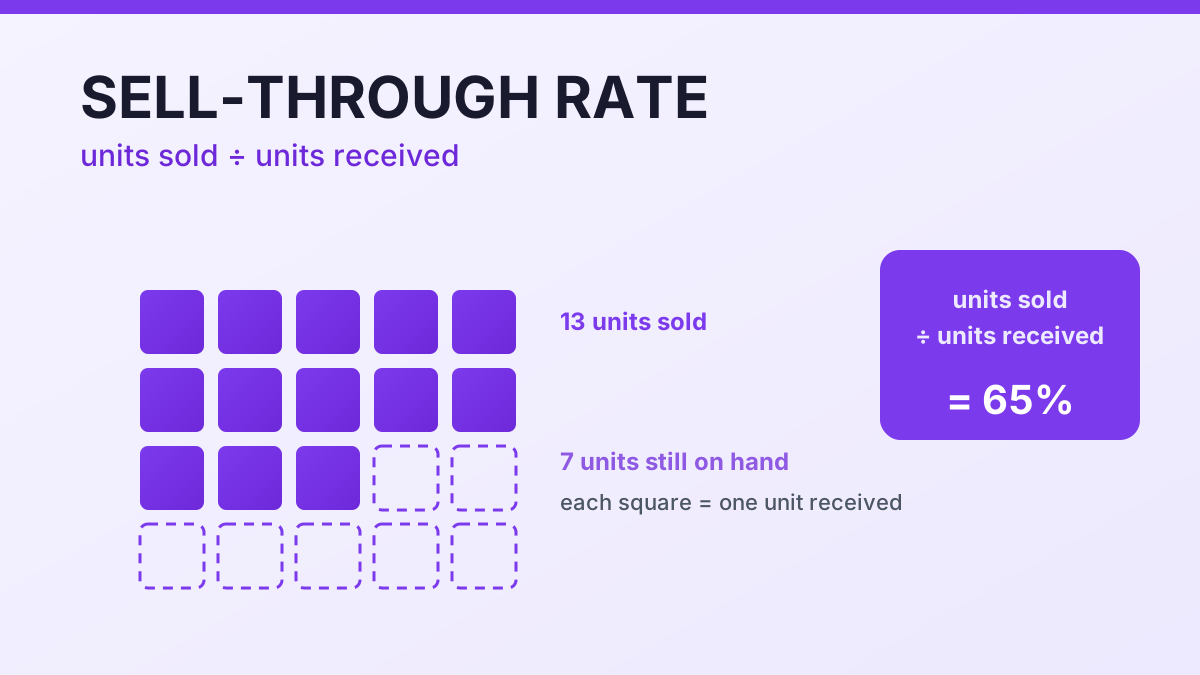
Sell-through rate is the share of units received that actually sold in the period: units sold divided by units received. Enter both counts and the sell through rate calculator adds the stock still sitting, its margin, and the weeks needed to clear it.
Calculate your sell-through rate
How to calculate sell through rate
Sell-through rate answers one narrow question: of the stock you committed to, how much sold inside the window you care about? Divide units sold, net of returns, by the units available in that window, then multiply by 100. A buy of 5,000 units that sells 3,200 by month end is running 64% — strong for seasonal apparel, soft for beauty, and a warning sign on a fast-moving line.
The denominator is where disagreements start, which is why this sell through rate calculator asks for both counts: receipts booked in the window belong there, not the opening balance. Where returns run at 20% or 30%, gross units overstate real velocity by double digits.
What is a good sell through rate in 2026
No single number is healthy everywhere: the target depends on category, price point and window. General retail guidance puts a sound in-period result at 70% to 80%, while verticals spread wider — from about 35% for premium footwear early in its cycle to 90% for beauty and personal care.
| Vertical or reference | Healthy sell-through | Warning threshold |
|---|---|---|
| General retail, in-period assortment (Shopify) | 70% to 80%, target 80%+ | Below 70% of the in-period goal |
| General retail, broader guidance (Lightspeed) | 60% to 80% | Below 40% signals overstock |
| Seasonal apparel and fashion | 60% to 85% | Below 50% by season end |
| Beauty and personal care | 75% to 90% per period | Below 65% per period |
| Home goods and furniture | 55% to 75% | Below 55% per period |
| Premium footwear, early cycle | 35% to 50% | Below 35% in early weeks |
The window matters as much as the percentage: fragrance moves near 23% in eight weeks and about 63% after a full year. Judging a slow category in week six against an apparel target is how healthy inventory gets marked down early.
How to use this calculator
- Count the units sold net of returns. Use net units, not gross shipments: where returns are frequent, gross counts overstate velocity.
- Apply the sell through rate formula to both counts. Divide units sold by the units available in the same window and multiply by 100. Mixing denominators — closing stock instead of receipts — is how two teams end up disagreeing about the same SKU.
- Add the weeks to get a selling pace. A rate alone does not say whether you are on track: 40% is excellent in week two of ten and alarming in week nine. The calculator adds a weekly pace and the weeks left to clear.
- Price the unsold units before the markdown does. Add unit price and margin to see the margin tied up in unsold stock — the number that decides whether a proactive 15% markdown beats a clearance event three weeks later.
Frequently asked questions
How to calculate sell through rate for a season?
Use the season as the window: units sold net of returns divided by units received that season, times 100. Keep the season length identical year over year, or a 12-week and a 16-week result stop being comparable.
What is a good sell through rate in 2026, and does my category change it?
General retail guidance puts a healthy in-period result at 70% to 80%, but verticals diverge: beauty 75% to 90%, seasonal apparel 60% to 85%, home goods 55% to 75%, premium footwear 35% to 50% early on.
How do you track inventory sell through rate by SKU?
Compute it per variant, not per category, and report weekly against a target curve for the window. Category averages hide the mix, so variant tracking is what tells you what to reorder and what to clear.
Is sell-through rate the same as inventory turnover?
No. Sell-through grades one buy over a month or a season; turnover is annual cost of goods sold divided by average inventory and grades the whole business over a year. A brand can have healthy turns and one bad seasonal buy at once.
What sell-through rate should trigger a markdown?
Read it as a gap to plan, not an absolute number: within about ten points of plan, hold price and monitor; 20 to 30 points below, mark down 30% to 40%; beyond that, plan clearance pricing.
Sell-through, full price and the cost of slow stock
Two numbers travel together: how much sold, and how much sold at full price. A 65% sell-through at full price is a strong buy; the same 65% produced by a flash sale is a margin event. Full-price sell-through is the version worth tracking — same formula, with only full-price units in the numerator.
Read that way, the metric becomes a markdown trigger rather than a report card: within about ten points of plan, hold price; 20 to 30 points below, mark down 30% to 40%; more than 30 points below, plan clearance at 40% to 60%. Run an inventory sell through rate per variant as well — variants at 90%, 90% and 45% average out to a comfortable number that hides what should be cleared.